Tuesday, April 7, 2015

Delhi


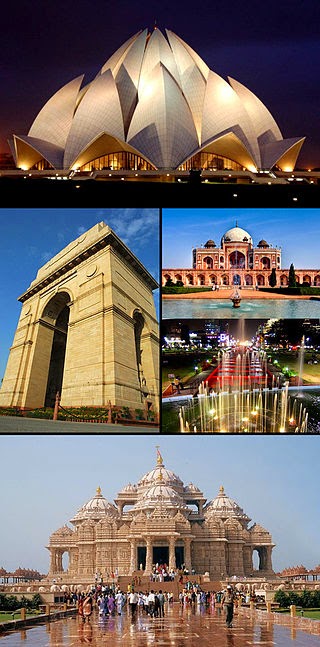
Delhi, officially the National Capital Territory of Delhi, is the capital territory of India. It has a population of about 11 million and a metropolitan population of about 16.3 million, making it the second most populated city in India. Through most of its history, Delhi has served as a capital of various kingdoms and empires.


The Akshardham templein Delhi is the largest Hindu temple complex in the world.


Lightning strikes near India Gate, New Delhi. Delhi receives much
 of its rainfall during the monsoon season which lasts from July to September.


The ancient Yogmaya temple, claimed to be
one of the five temples of the Mahabharata era in Delhi.


Supreme Court of India


The Delhi-Gurgaon Expressway

Delhi Metro train


http://www.mapsofindia.com/
http://cseindia.org/node/835
http://www.hindustantimes.com/india-news/delhi-has-dirtiest-air-china-data-foggy-who/article1-1216605.aspx
http://books.google.co.in/books?id=MsYj4ysWQ6sC&pg=PT7&dq=delhi+was+declared+capital+of+india&hl=en&sa=X&ei=HSTkT8u5FM_yrQfT-MXrCA&ved=0CEEQ6AEwAg#v=onepage&q=delhi%20was%20declared%20capital%20of%20india&f=false

Monday, April 6, 2015

Economics

Introduction

Since India offers many great things we use on a daily basis, India's main economic activity is Textile Exportation and Hi-Tech call centers.


Textile Exportation

In the western states of Gujarat and Maharashtra are known for their great industrial and financial power. Their agriculture is also a big part of India. Since it is one of the first places to experience industrialization, and their textile mills are still one of the most productive in the region. Since the western part of the state of Gujarat in one of India's main manufacturing centers. 


Hi-Tech Call Centers

Global organizations have always preferred outsourcing call center services to India, when compared to outsourcing to China, Philippines, Malaysia and other Asian countries. India has always been the most preferred outsourcing location, because call centers in India offers a wide variety of advantages that other countries do not offer. Today, having call centers in India has become the norm for several global companies. Many international organizations are also setting up call centers in India, because India has a large qualified workforce and can also provide cost-effective call center outsourcing services (Call Center Services).

I wanted to check out what a call center was like. This is an example of one on their website:

CCI launches India’s sole end-to-end Cisco IP network based Call Center 
Call Centers in India employ the best of technologies along with employing the best human resource to ensure quality service. "VCare Corporation" has proven to be the pioneer in the industry by adapting completely the superior CISCO solution. Besides, it also boasts of state of the art infrastructure in the expanse of 35,000 square feet, with 2700 work stations and over thousands employees. 


http://www.callcentersindia.com/
http://www.outsource2india.com/why_india/articles/call_centers_india.asp

Sunday, March 29, 2015

Agriculture


A panoramic picture of a farm in India

Recently

Today, India is ranked second worldwide in the "farm world". Although agriculture is one of the broadest economic sector and has a massive role in the overall socioeconomic fabric of India as a whole. India also contributes a significant figure to the Gross Domestic Product (GDP). Sustainable agriculture, in terms of food security, rural employment, and environmentally sustainable technologies such as soil conservation, sustainable natural resource management and biodiversity protection, are essential for holistic rural development. Indian agriculture and allied activities have witnessed a green revolution, a white revolution, a yellow revolution and a blue revolution (India.gov).


Major Crops & Farms

In India, it is a large producer of various fruits, rice, wheat, vegetables, major spices and much more. Farms in rural India are usually small plots or smaller fields. In the recent decades, the agriculture in India has doubled in that time span. India also has a great "cash crop", such as cotton and coffee. For example, in 2009, India has the third largest producer of oranges, beans, peas and eggs. The Indian culture has a very diverse agriculture which can range from very poor parts and very developed modern farm villages. 

Various crops across India


Challenges

Three agriculture sector challenges will be important to India’s overall development and the improved welfare of its rural poor:
1. Raising agricultural productivity per unit of land: Raising productivity per unit of land will need to be the main engine of agricultural growth as virtually all cultivable land is farmed. Water resources are also limited and water for irrigation must contend with increasing industrial and urban needs. All measures to increase productivity will need exploiting, amongst them: increasing yields, diversification to higher value crops, and developing value chains to reduce marketing costs.
2. Reducing rural poverty through a socially inclusive strategy that comprises both agriculture as well as non-farm employment: Rural development must also benefit the poor, landless, women, scheduled castes and tribes. Moreover, there are strong regional disparities: the majority of India’s poor are in rain-fed areas or in the Eastern Indo-Gangetic plains. Reaching such groups has not been easy. While progress has been made - the rural population classified as poor fell from nearly 40% in the early 1990s to below 30% by the mid-2000s (about a 1% fall per year) – there is a clear need for a faster reduction. Hence, poverty alleviation is a central pillar of the rural development efforts of the Government and the World Bank.
3. Ensuring that agricultural growth responds to food security needs: The sharp rise in food-grain production during India’s Green Revolution of the 1970s enabled the country to achieve self-sufficiency in food-grains and stave off the threat of famine. Agricultural intensification in the 1970s to 1980s saw an increased demand for rural labor that raised rural wages and, together with declining food prices, reduced rural poverty. However agricultural growth in the 1990s and 2000s slowed down, averaging about 3.5% per annum, and cereal yields have increased by only 1.4% per annum in the 2000s. The slow-down in agricultural growth has become a major cause for concern. India’s rice yields are one-third of China’s and about half of those in Vietnam and Indonesia. The same is true for most other agricultural commodities.
Policy makers will thus need to initiate and/or conclude policy actions and public programs to shift the sector away from the existing policy and institutional regime that appears to be no longer viable and build a solid foundation for a much more productive, internationally competitive, and diversified agricultural sector (World Bank). 


Conclusion

In conclusion, India has an excellent agriculture for its time, and it seems to only be growing. Although India is known for being extremely poor, not too many people understand that we get many spices and food sent over from this lovely country. 


References:
http://www.worldbank.org/en/news/feature/2012/05/17/india-agriculture-issues-priorities
http://tejas.iimb.ac.in/interviews/12.php

Monday, March 16, 2015

Human Development Report


Defining Human Development:

Human development is defined as the process of enlarging people’s freedoms and opportunities and improving their well-being. Human development is about the real freedom ordinary people have to decide who to be, what to do, and how to live. 


Central to the human development approach is the concept of capabilities. Capabilities—what people can do and what they can become-are the equipment one has to pursue a life of value. Basic capabilities valued by virtually everyone include: good health, access to knowledge, and a decent material standard of living. 


The History of Human Development:

The human development concept was developed by economist Mahbub ul Haq. At the World Bank in the 1970s, and later as minister of finance in his own country, Pakistan, Dr. Haq argued that existing measures of human progress failed to account for the true purpose of development which was to improve people’s lives. To be more exact, he believed that the commonly used measure of Gross Domestic Product failed to adequately measure well-being. Working with Nobel Laureate Amartya Sen and other gifted economists, in 1990 Dr. Haq published the first Human Development Report, which was commissioned by the United Nations Development Program. 


Indicators:


Education: 
 
Mean years of schooling: 4.43

Poverty: 

Population in multidimensional poverty (%): 55.28

Demography:

Population total (millions): 1,252.14

Public Data Explorer:

While looking at the public data explorer, I realized that India was low on the graph, at 0.38 for the year 1980. At the year 2013, India was at 0.59.


All information about India in this blog can be found at: 

References:http://hdr.undp.org/en
http://www.measureofamerica.org/human-development/
http://www.livescience.com/28634-indian-culture.html

Monday, March 2, 2015

Criminal Activity Rate

India's flag


In India, the location plays a massive role just like other countries. The location has a significant impact on crime in India. In 2012, Kerala reported the highest cognizable crime rate of 455.8 among States of India, while Nagaland recorded lowest rates (47.7). The rates were calculated by National Crime Records Bureau as the number of incidents per 1,00,000 of the population.


Crime in general since 1953 to the year 2007 has increased for the most part. Murder has dropped in 2007, Kidnap increased and so did rape. I was unable to find a more recent graph to depict this information.


The crime rate against women in India in earlier days were not usually reported. Since many cases were not registered with the police due to the social stigma attached to rape and molestation cases, things have changed in a more modern day. Official statistics actually show there has been a drastic increase in the number of reported crimes against women which is a great thing. 


Crime Against Women Fact Video


Interesting Criminal Justice Facts about the NCRB:

  • National Crime Record Bureau (NCRB) is the first organization to have installed the Automated Finger Print Identification System (AFIS) called Fingerprint Analysis and Criminal Tracking System (FACTS) in India. Only a few countries in the world may claim to have a FACTS.
  • Located at New Delhi as the attached office of Ministry of Home Affairs (MHA), Government of India, NCRB is mandated to empower the Indian Police with Information Technology for modernization of Indian Police.
  • Digitized fingerprints database is also being maintained at NCRB. In the near future, the live scanner based remote query facility and it would be one of the largest networked computer-systems in India, in the aid of the Criminal Justice System.
  • Each year this Bureau conducts an average 22 training programs for Indian Police Officers in subject like Programming.
  • NCRB has the proud distinction of installing 762 server - based computer systems at every District Crime Records Bureau and State Crime Records Bureau, across the country, 'Crime Criminal Information system (CCIS)’ project, with a view to maintain a National - level Database of Crimes, Criminals and Property related to crime.


     (All information about the NCRB can be found at http://ncrb.gov.in/)


References:
http://www.nationmaster.com/country-info/profiles/India/Crime
http://ncrb.gov.in/
http://ibnlive.in.com/news/crime-map-of-india/428809-79.html

Monday, February 16, 2015

Population Statistics


India's Flag


India's population as a whole, taken in 2014 stands at 1,236,344,631.


Life Expectancy 


This graph indicates that India has a smaller life expectancy rate than China.

Population


This graph shows how much the population is rising at very high numbers.
 Recently, the numbers have reached the highest point to date, in 2015. 


Sex Population 

The Central Intelligence Agency explains this chart in great detail; when a population pyramid illustrates the age and sex structure of a country's population and may provide insights about political and social stability, as well as economic development. The population is distributed along the horizontal axis, with males shown on the left and females on the right. The male and female populations are broken down into 5-year age groups represented as horizontal bars along the vertical axis, with the youngest age groups at the bottom and the oldest at the top. The shape of the population pyramid gradually evolves over time based on fertility, mortality, and international migration trends.


Other statistics I found interesting: 


Life Expectancy at birth
total population: 67.8 years
male: 66.68 years
female: 69.06 years (2014 est.)

Mother's mean age at first birth:
19.9%

Gross national income per capita:
5,300

Area: 3,287,270

Literacy Percent: 60


Dark Facts About India: 


-About half of the total maternal deaths occur because of hemorrhage and sepsis. A large number of deaths are preventable through safe deliveries and adequate maternal care.
-More than half of all married women are anaemic and one-third of them are malnourished (have a body index below normal).-Globally, every year over 500,000 women die of pregnancy related causes and 99 percent of these occur in developing countries.


After looking at these graphs, I found it very interesting to notice the numbers that coincide with the information. Since India is very poor, I was not really that surprised to see that men and women only lived until roughly 65 years old. 


References:
 http://blogs.worldbank.org/psd/why-china-ahead-india-fascinating-analysis-amartya-sen
https://www.cia.gov/library/publications/the-world-factbook/geos/in.html
http://www.healthissuesindia.com/poor-sanitation/


Tuesday, January 20, 2015

Three Thematic Maps


India's Flag

  • What are Thematic Maps?

Thematic Maps are designed to display specific "complicated spatial phenomena". This could include information such as population density, per capita income, or even climate levels. Some of these maps also contain what are known as "flow arrows", signifying movement whether it be people or goods.  

  • What are three examples of Thematic Maps?

Air Network Thematic Map


This map shows the air traffic routes for airlines navigating Indian air space. By looking at this map, we are able to see examples of flow arrows that signify the movement of aircraft.

Annual Rainfall Thematic Map

This map of India shows the annual rainfall which is due to the South East Asian climate levels. The rainfall is shown by color which makes is very easy to see which area gets more rain compared to areas which may get a less amount of rain.

2011 Population Thematic Map

In this map, we are able to see the more heavy populated areas compared to the less populated of India. The more populated areas of this map include the major cities. 


References:
All three India map images can all be found at: http://mapsofindia.biz/thematic-map.html#